Heatmap with Python and GoogleMaps Tutorial
As a product manager, I always look to upgrade my skills and learn new things. But only learning doesn’t help unless you actually implement it and make its use.
One such thing happened with me in June 2020. I was pursuing Python for Data Science and Machine Learning Bootcamp from Udemy and we were into our weekly leadership meeting when Jitendra Rawal, Head of Operations at Frendy, started a discussion around measuring the density of orders being delivered in Covid-19 situation across the city so as to optimize operations and deliveries. Since we store the location of our delivery fleet when they mark the order as delivered from the app, we already have the lat-long co-ordinated of all the orders. So, the only task we had was to plot the heatmap on Google maps and we can easily have the data visualization.
We have a dedicated AI/ML team in the company, still, I thought that why not make use of this to test myself and put effective learning into practice. I told the team that I will be able to solve this for them and get back within 24 hours. And so I did it and here’s how you could do it too.
I used a Jupyter Notebook environment for running Python scripts which can be easily set up using Anaconda. You will require to use Pandas library.
import pandas as pdFor beginners, just pressing Shift + Enter will execute your code line in the notebook.
Next, you will need to install the Google Maps library as the heat map will be plotted over the maps.
import gmaps
import gmaps.datasets
Once done, you will need to configure the Google Maps with an API Key for a Google project with Maps Javascript API enabled. The API has a free-usage limit and you will need to enable billing to have its access. Don’t worry as Google Cloud Console offers $300 for first-time users for free and only using this API for learning purposes will never deplete the free quota. I still use it for free! Please make sure that you DO NOT share your API key in public.
gmaps.configure(api_key='YOUR_GOOGLE_MAPS_API_KEY')So now it’s time to import the locations. First of all, create a .CSV file storing all the latitudes and longitudes. The title of columns A and B should be latitude and longitude respectively. When the file is ready, you will need to host it on cloud for direct read/download access. For convenience, I uploaded it on Amazon S3 and took its public link for use. You can use any of the hosting providers for media storage.
Now, you need to find and EDIT the file called “datasets.py” in gmaps package. It should be located mostly at an address like this -
C:\Users\Lenovo\anaconda3\pkgs\gmaps-0.9.0-py_0\site-packages\gmaps\datasets
Once found, please add the following code in the METADATA object of the file datasets.py
"PROJECT_NAME": {
        "url": "YOUR_PUBLIC_URL_OF_.CSV_FILE",
        "description": "ANY_DESCRIPTION_YOU_WANT",
        "source": "YOUR_WEBSITE",
        "headers": ["latitude", "longitude"],
        "types": [float, float]
    },
As you can see, PROJECT_NAME will be next called in through the GoogleMaps datasets in Python to load the CSV file. Once done, save this file and jump back to your jupyter notebook for running python scripts.
locations = gmaps.datasets.load_dataset_as_df('PROJECT_NAME')
fig = gmaps.figure(map_type='HYBRID')
heatmap_layer = gmaps.heatmap_layer(locations)
fig.add_layer(heatmap_layer)
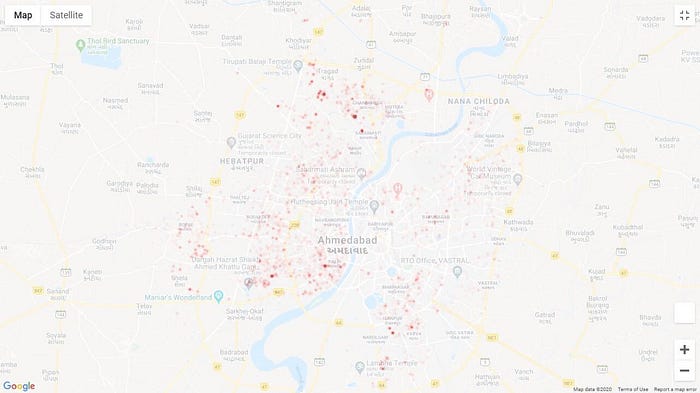
figIf everything goes well, you should be able to see a heatmap below. For the test purpose, I used a sample size of our actual data for rendering this, it shows the heat map plotted for the deliveries done by Frendy in the city of Ahmedabad for a few days.

That is it. You can now toggle between Map and Satellite view or can also play around with some colours used for plotting by running the following code:
heatmap_layer.max_intensity = 100
heatmap_layer.point_radius = 5heatmap_layer.gradient = [
    'silver',
    'green',
    'yellow'
]
The colour gradient of the heatmap is specified as an array of CSS colour strings. All CSS3 colours — including RGBA — are supported except for extended named colours and HSL(A) values.
You can come up with various variations. For the same data, I changed the gradient colours to also get this heatmap. It totally depends upon how you would like to visualize it.
For learning more on this, you can check out the below links that I found useful:
I hope you liked this simple tutorial on creating your own custom heatmaps with GoogleMaps and Python. Do reach me out on LinkedIn to say ‘Hi’ if this works for you too, I would be glad to know that.
Check out valuable insights, tips, strategies and fundamentals on Product Management on my YouTube channel — Parth Amin’s YouTube Channel
